-By Sriroop Chaudhuri and Mimi Roy, Assistant Professors at Jindal School of Liberal Arts and Humanities
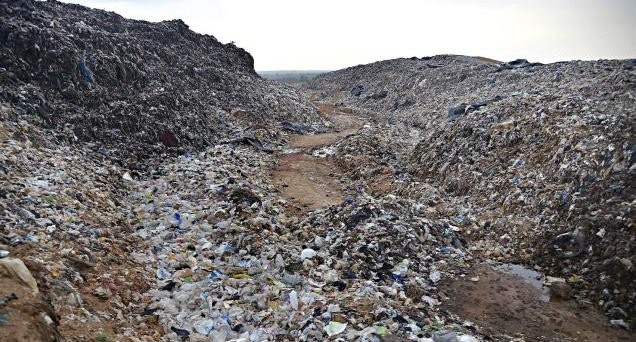
Sustainable waste management has emerged as one of the stealthiest challenges that international authorities are facing these days. Recent findings on the waste-climate nexus further perplex experts.
The International Panel on Climate Change (IPCC) estimates that about 3 per cent of global greenhouse gases (GHGs) in 2010 came from (mis)mismanagement of solid wastes, mostly the landfills (municipal solid waste).
The question is, to what extent did it affect an already fragile climate? Is that change reversible?
Reports of Global Waste Monitoring Outlook (GWMO), a UN-based R&D organisation, suggest that about 2 billion people globally are still “deprived” of solid waste collection facilities, with the most severe cases observed in low/middle-income nations.
Here’s a split in the deal: while over 95 per cent of municipal solid waste (MSW) disposal activities are “controlled” in high-income nations, it is dismally below the half-line mark for low/middle-income countries, with a substantially low waste-collection-coverage.
Close ties between gross national income (GNI) levels and waste generation have been on debate for a while. Recent GWMO reports attest to it. It appears that the volume of MSW generated on average in high-income nations convincingly outsmarts the low/middle-income brothers by over six orders of magnitude.
Along similar lines, another GNI-split lie in organic waste load, hovering around 50 per cent of total waste load in low/middle-income nations while about 30-35 per cent in their wealthier counterparts. The split’s also glaring in the nature of organic waste generated.
In middle/low-income countries, most organic waste is of “unavoidable” type – food residue deemed unfit for consumption. Now it’s just the opposite for high-income countries where it’s rather the avoidable type – food that could have been consumed. Paper waste can also be tied to GNI where it’s a high-high bond: high-income countries generating far higher volumes.
But here’s the funny part: the high-income nations are still light years ahead. At least by ensuring about 95-100 per cent of waste collection coverage. In comparison, south Asian nations (representatives of middle/low-income nations?) current average around 48 per cent. India (51.1 per cent) is barely ahead of China (49 per cent), Sri Lanka (35 per cent) and Bangladesh (20 per cent).
To add to the misery, high-income brothers have practically zero “unsound” waste disposal while in India, about 85 per cent appears unsound. Moreover, the high-income nations are recycling over a fifth of their waste on average, which means they are viewing wastes more as resources.
Several high-income nations have already began community-led “cash-for-trash” programmes to encourage citizens’ forums to participate in the waste management machinery. As added benefit, these programmes are creating job opportunities. So basically, albeit producing more waste, high-income nations are indulging in a circular economy. In addition, they have devised innovations to cut-off most of wastes upstream, at the very source: prevention’s better than cure.
A major stumbling block in having a grip on waste management is lack of spatially and temporally stratified data. The GWMO links it to the dearth of standard (a) definition and classification of wastes (b) protocol for (waste) measurement, and (c) reporting system.
Definitions of waste vary considerably across space and time, but to keep it simple for a moment, waste can probably best be divided into three main categories (1) municipal solid waste (MSW) or waste from households (2) construction and demolition (C&D) and (3) commercial and Industry (C&I). Additional categories include (a) power generation and (b) water supply, sewage treatment, land remediation and waste management.
But knowing all these, the question is, do we have a system diverse/robust enough to keep track of the individual items listed above? What about India? Is there an open-sourced governmental database for MSW types/loads generated for the municipal wards?
What if a researcher “aspires” to track temporal changes in MSW generation in a particular municipal ward and then compare it with other wards? Probably, he/she might also want information on segregation details: MSW load fractionated into organics, paper waste, e-waste, metals, plastics….etc.
What’ll be his/her best bet? Sadly, the truth for now is, an economy overwhelmingly boasting on going digital, appallingly lacks a digital system to monitor, assess, and update everyday MSW loads even for the larger municipalities.
Among key recommendations of GWMO, one is to “assemble standardised performance indicators on waste management that allow benchmarking exercises and facilitate better analysis of waste and provide a standardised system to monitor progress”.
But for this, we would need continuous, real-time collection and collation of comprehensive, credible and latest data. We would need skilled technicians, latest technology. The grinder is: should we care in the first place?
If yes, then we might then have to “borrow” technology/workforce from our wealthier cousins for now. But won’t it be expensive? Or politically irksome? More importantly, political gurus will also have to work on their polity’s conscience. Our conscience. Our attitude. Our awareness. But do they consider it worthwhile to waste man power/resources/time/votebank on waste?
(The article was originally published in Daily O)

